"Health science has mapped our genome, microbiome, and environment; but everyday behavior has remained largely invisible. This post explores the "Screenome," a new frontier that captures the digital traces of daily life and opens a powerful lens on how behavior shapes health."
Latest News & Updates
What Your Phone Knows Could Help Scientists Understand Your Health
"Stanford scientists have released an open-source platform that lets health researchers study the “screenome” – the digital traces of our daily lives – while protecting participants’ privacy."
An open-source platform for multimodal digital trace data collection from smartphones
We developed an open-source platform that enables in situ capture of multimodal digital traces from smartphones (for example, moment-by-moment capture of screenshots, application usage logs, interaction histories and phone sensor readings)...

Mapping the Human Screenome: Our Vast Digital Lives
"In this episode of School’s In, Professor Nilam Ram discusses the Human Screenome Project, a research study that explores cell phone usage and what it says about the way we process information."
The Screenomics Data Collection App
The Stanford Screenomics Project introduces an open-source platform for Screenomics
research, enabling in-situ, real-time capture of multimodal digital traces from users’ smartphones as they go about their everyday lives.
Time for the Human Screenome Project
Media are critically important in areas of wellbeing, democracy, poverty, violence, education, climate action and more.
But in spite of big data promises, no one really knows what people actually see and do on their screens in an increasingly complex digital world.
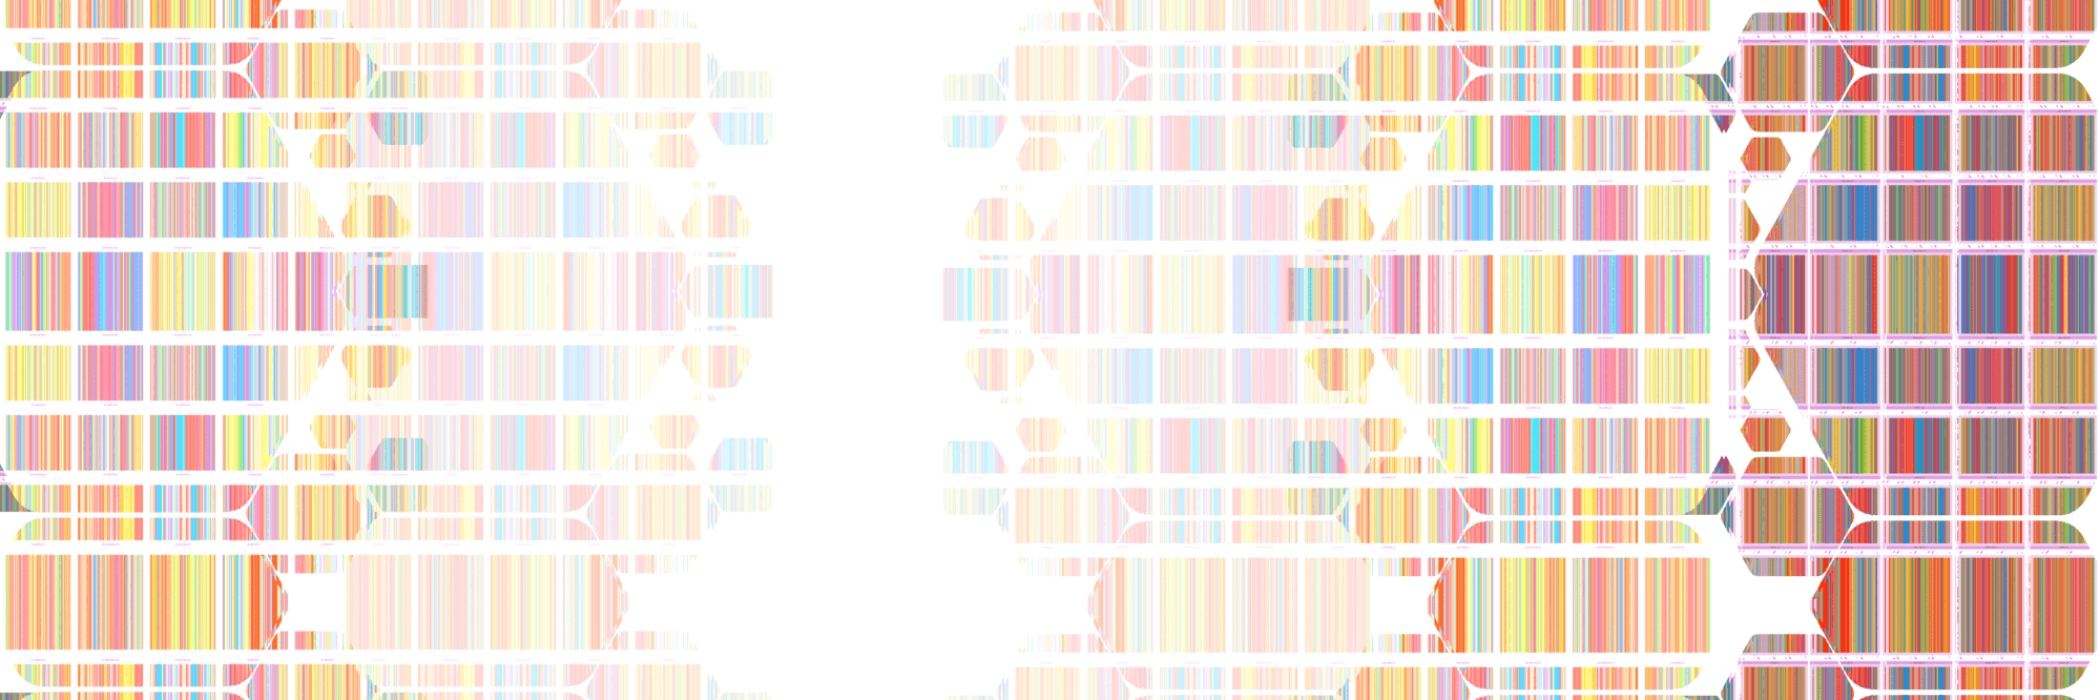
A Screenome
Visualization produced by Nilam Ram
This video shows a sample screenome, a movie of one person’s smartphone use for 3 minutes. Every 5 seconds that the phone screen is activated, a screenshot is recorded, compressed, encrypted and transmitted to secure servers at the Human Screenome Project at Stanford University. The video shows a compilation of screens that represents 15 mins of use over approximately 2 hours of one day.
The screenome demonstrates that digital content is diverse and fragmented, with different content threaded into sequences that break apart traditional message (e.g., videos, news stories, conversations) but make sense to individual users.
The color bar indicates different phone application types (as categorized in our Nature paper). The “fuzz” on the outside of the color bar indicates number of words on each screenshot (as a proportion of the maximum number of words): The larger the fuzz, the less the words are on the screen.